A/B Testing
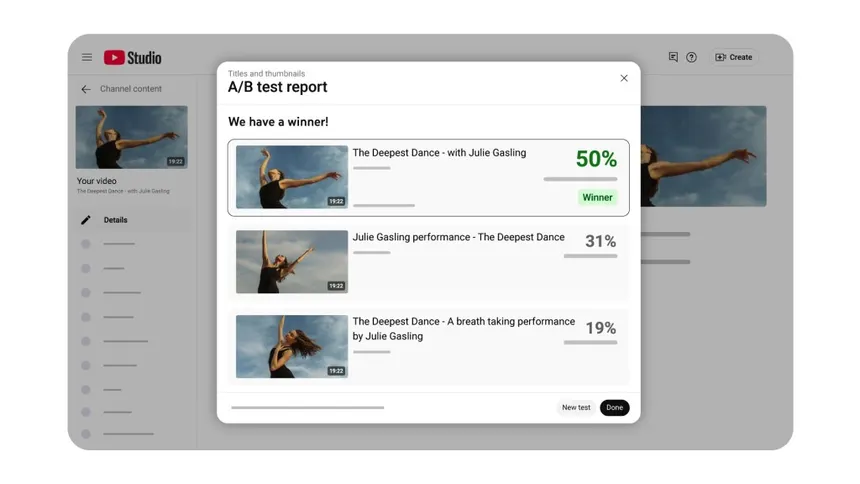
A/B testing feels jargon-y, but it's actually incredibly simple. Take an interface A and an interface B, and show them to users randomly. Then, assess users' behavior in reaction to each interface given a metric. You have done A/B testing! Businesses typically test users on click-through rates or conversions (money spent) to determine the best interface to suit their goals.
Multiple iterations of this process can be used to isolate specific features of a given interface. This is known as feature flagging, where a feature is only enabled for a subset of users. This allows businesses to test the effectiveness of a feature in isolation, and to roll out the feature to all users if it is successful.
How layout shapes what readers take away
When the same article is set as uninterrupted paragraphs with only an occasional heading, readers often report that it feels thorough or authoritative even before they finish. The tradeoff is higher cognitive load: people who are scanning for one fact may leave without finding it, which shows up in metrics like bounce rate or time-to-first-scroll in A/B tests.
Product teams sometimes pair that dense style with subtle typographic choices, tighter line height, smaller subheads and measure whether completion rate or perceived trust moves. The hypothesis is usually that “serious” presentation nudges people to treat the piece as definitive, not that the words themselves changed at all.
In practice, A/B testing this kind of layout means serving two templates to randomly assigned visitors, then comparing outcomes: time on page, scroll depth, shares, or downstream conversions. Feature flags make it possible to roll the winning template out gradually instead of flipping the whole site at once.
Which presentation fits this article best?
There is no wrong answer. This mirrors how teams collect qualitative signal alongside metrics.